Visual Feedback
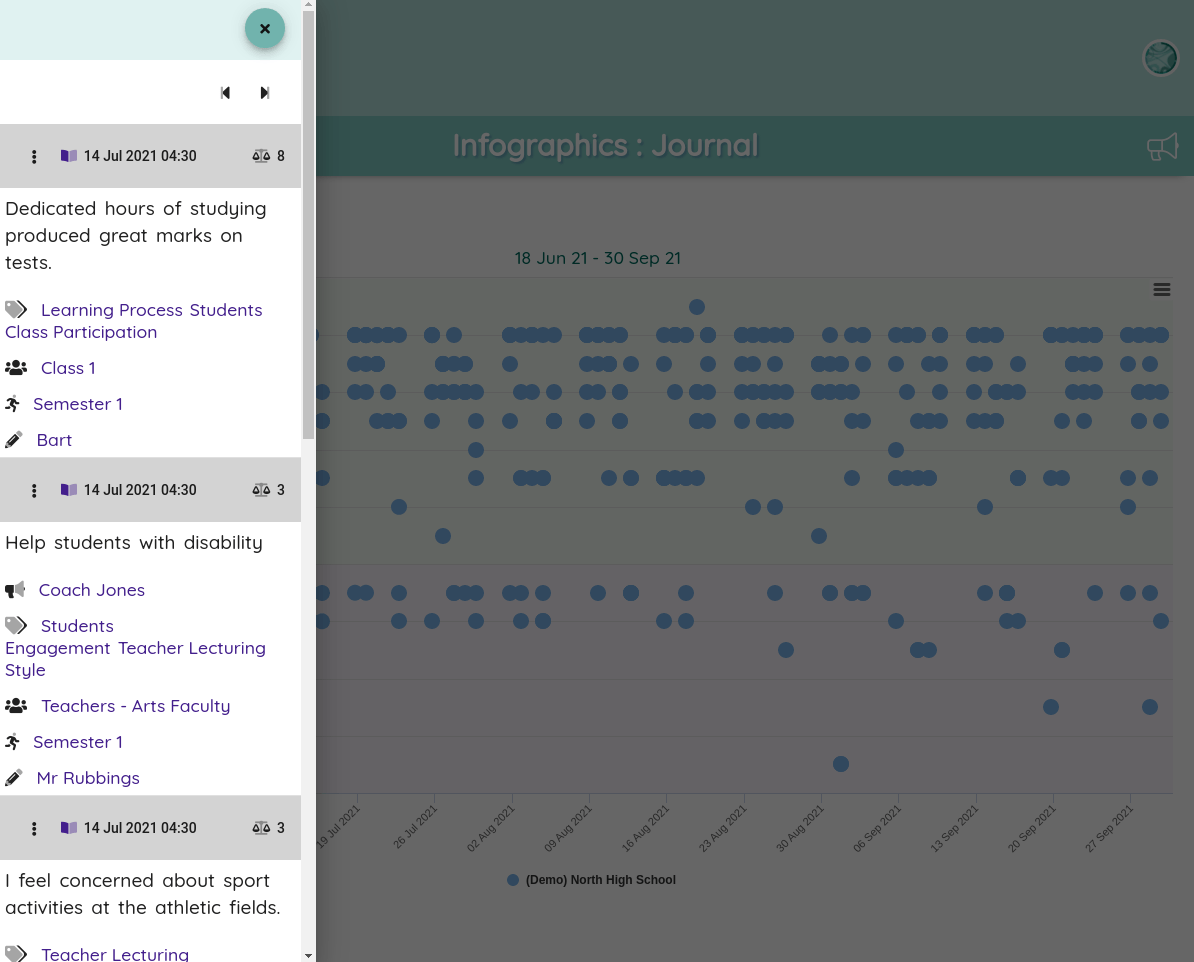
Neelix aggregates data from posts in the classroom journal and provides interactive infographics.
Get an easy view into multiple themes - overall by educational institution, faculty, classroom, activity, experience category, activity, any timeframe.


“There are two ways to be fooled. One is to believe what isn't true; the other is to refuse to believe what is true.”
– Soren Kierkegaard
Rich Interaction Charts
- Triangulated experiences chart (overlay journal, retrospective and time capsule message trends)
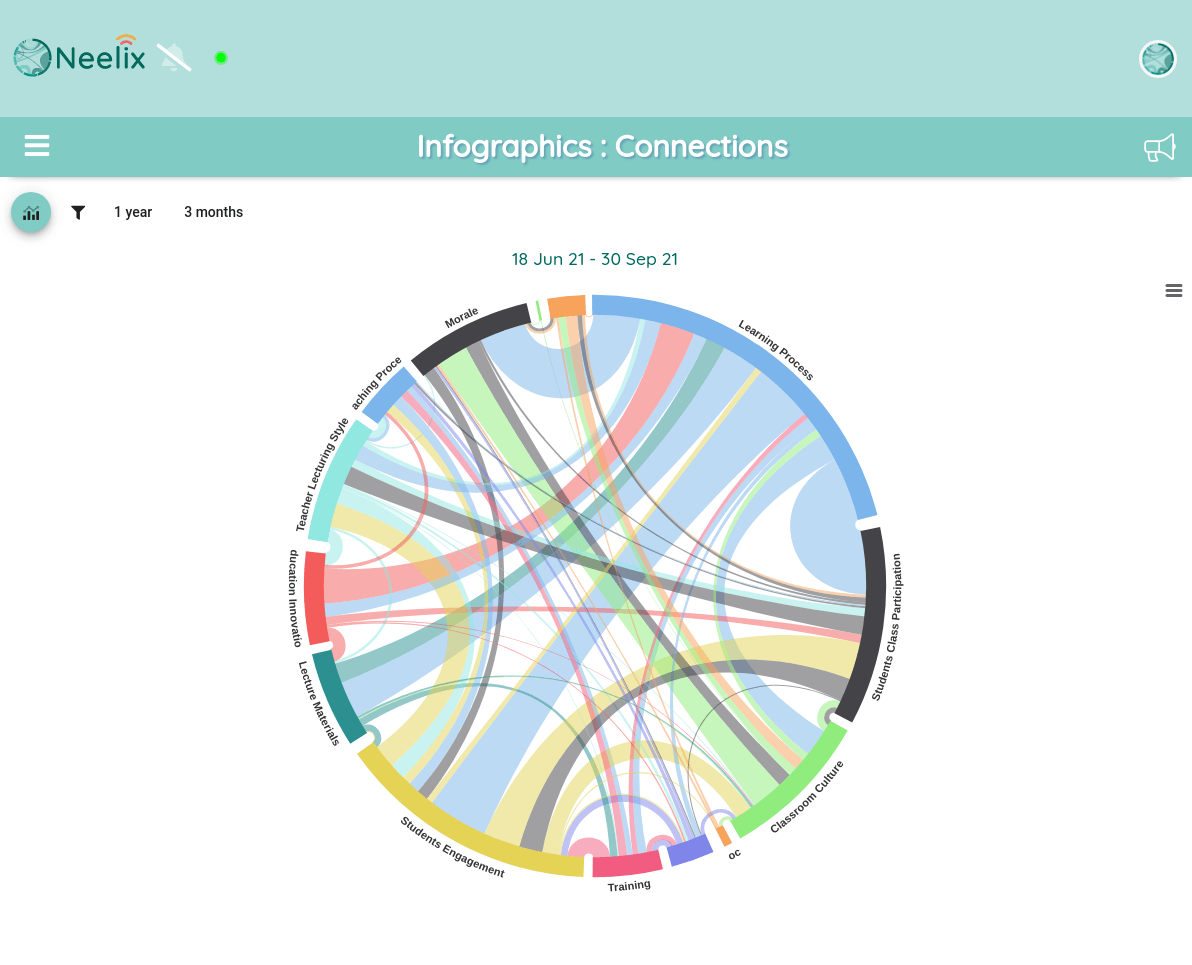
- Connections between experience categories
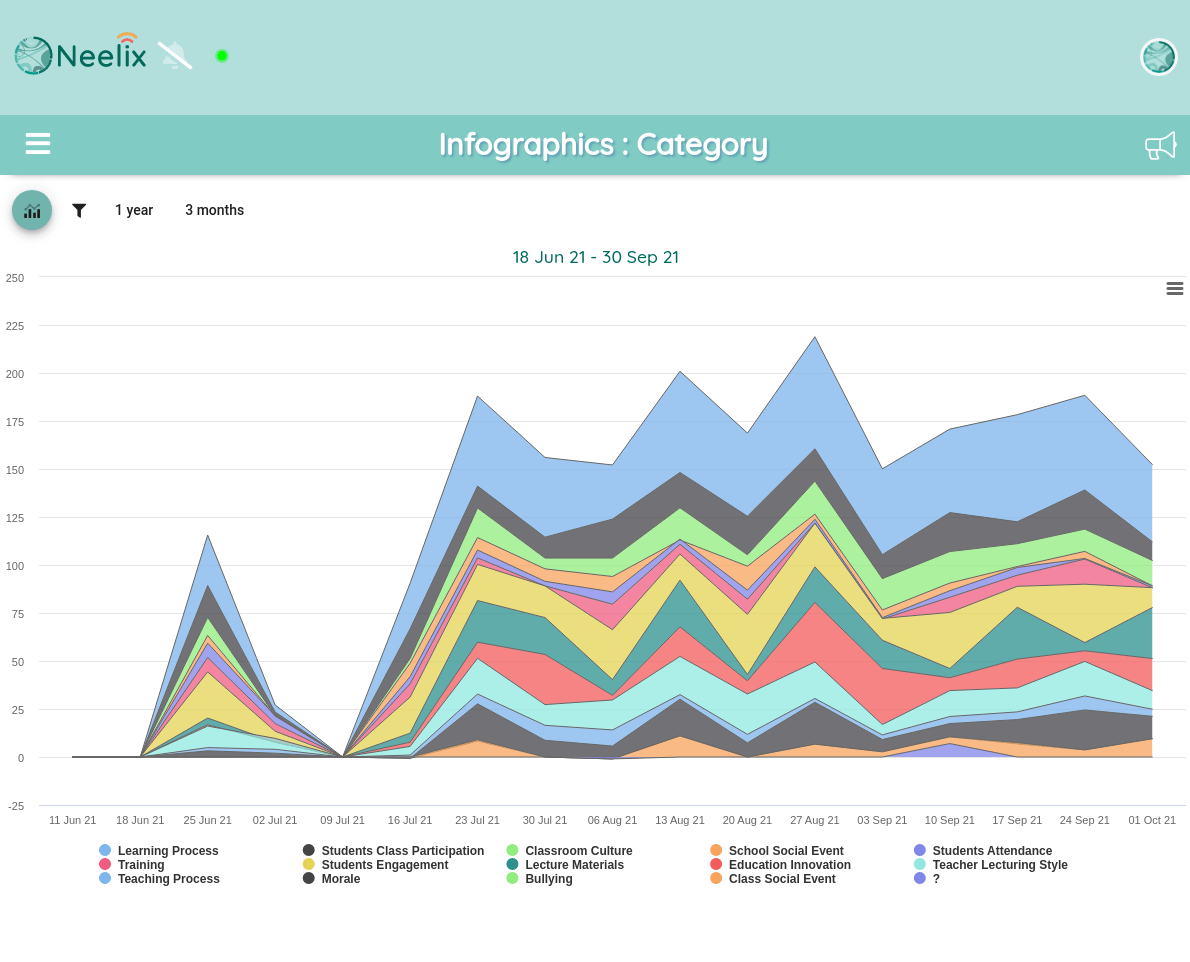
- Stacked category trends for journal posts
- Stacked category trends for retrospective conversations
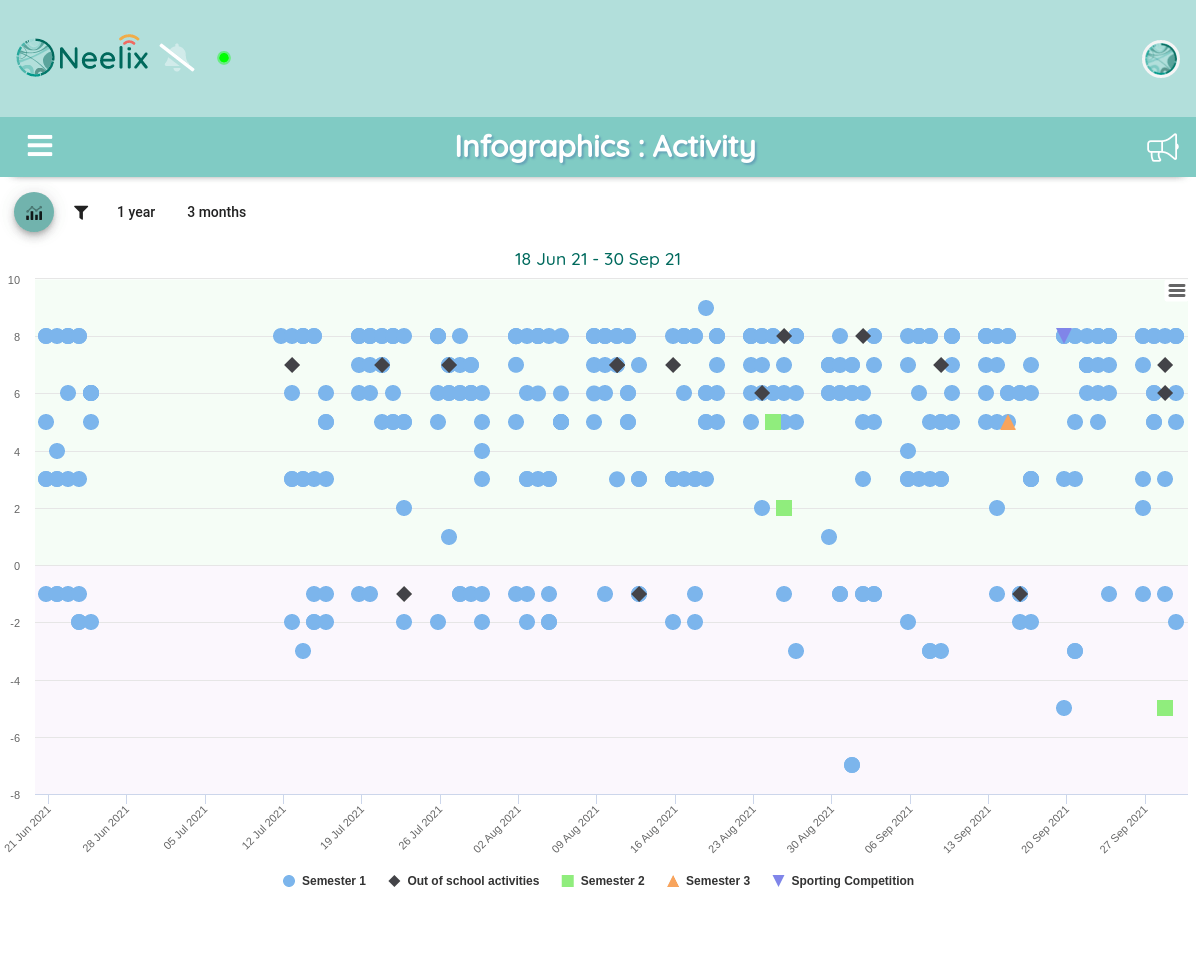
- Activities scatter diagram
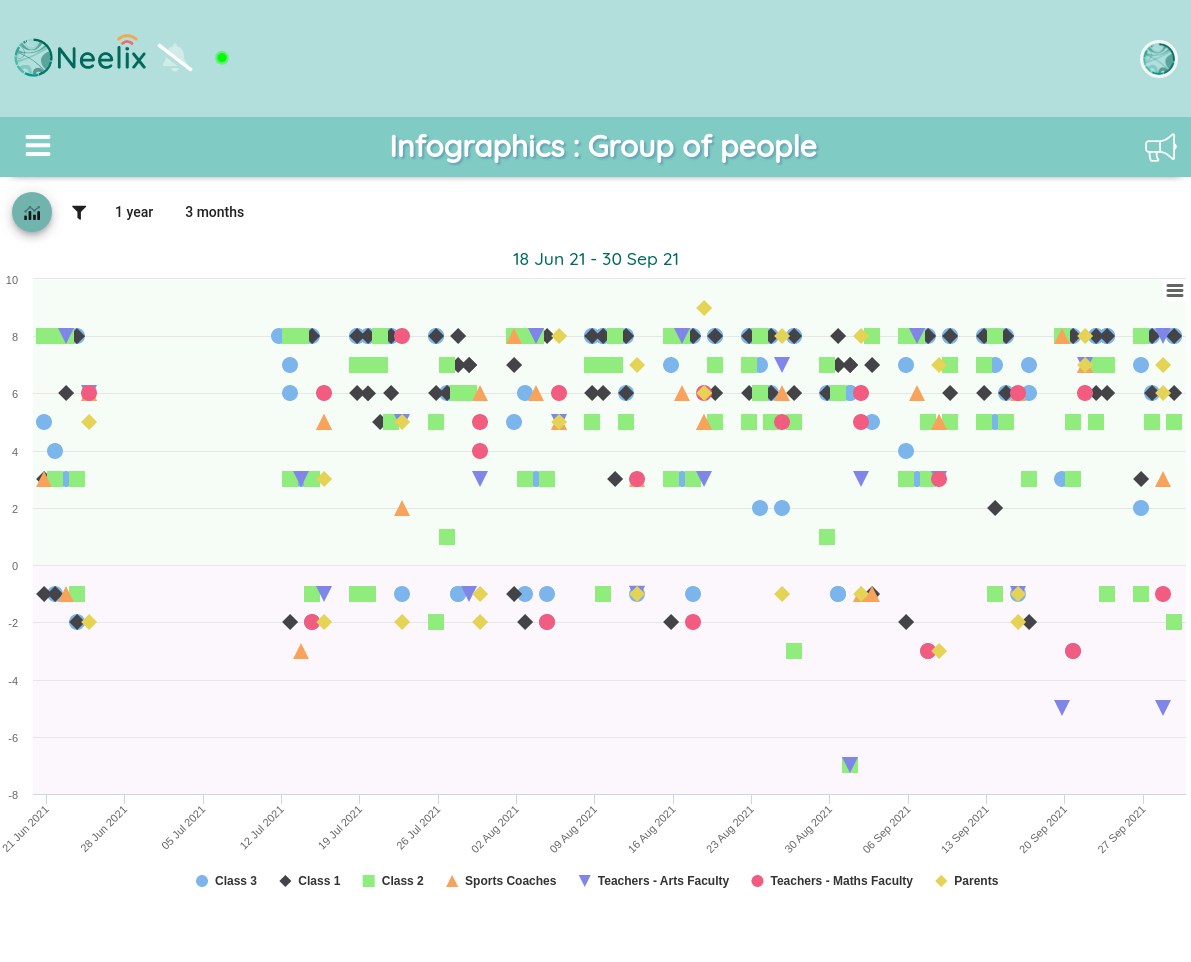
- Teams scatter diagram
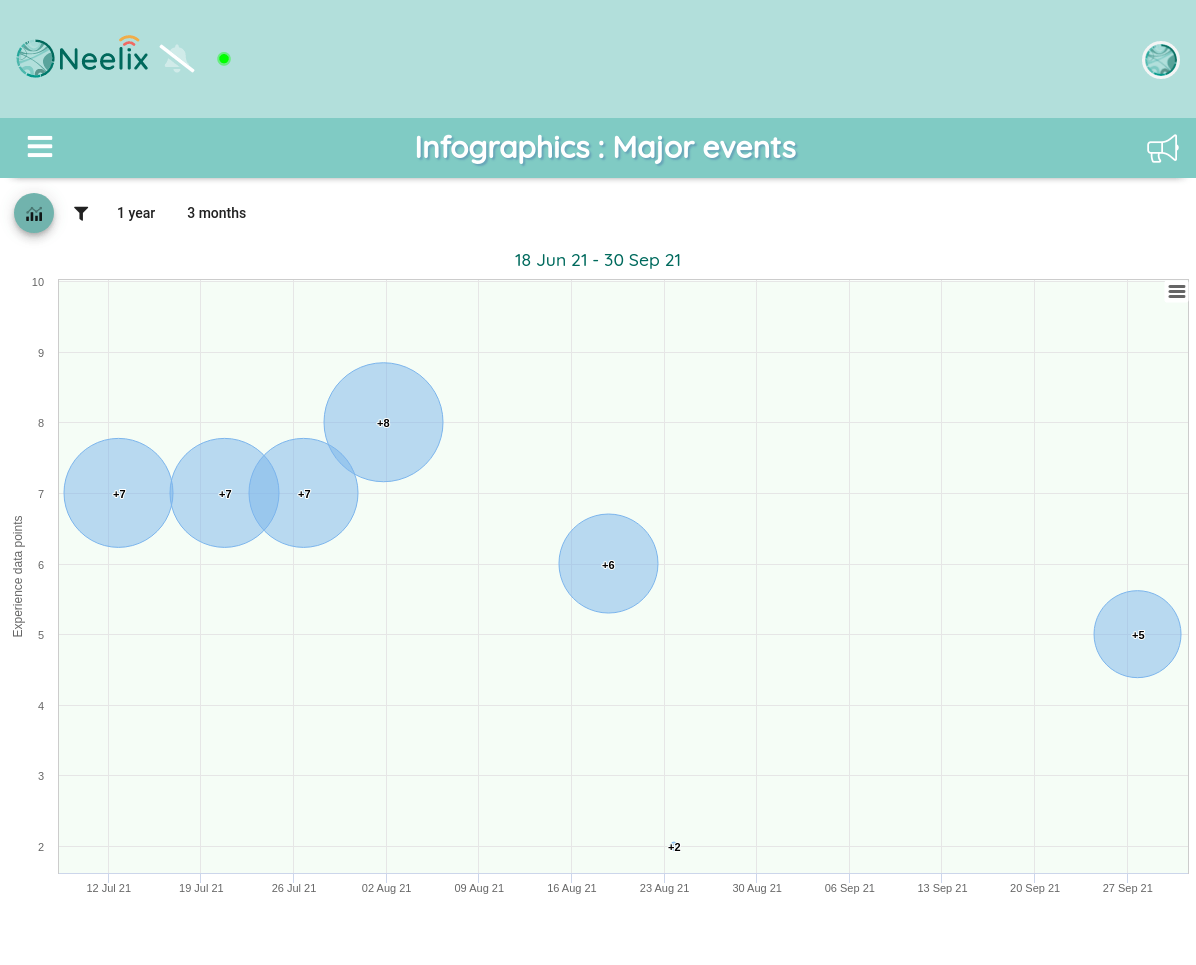
- Major events bubble chart
- Journal level / consortia scatter diagram
- Causality chart
- Retrospective
- Time capsule messages charts
- Expectations analysis chart
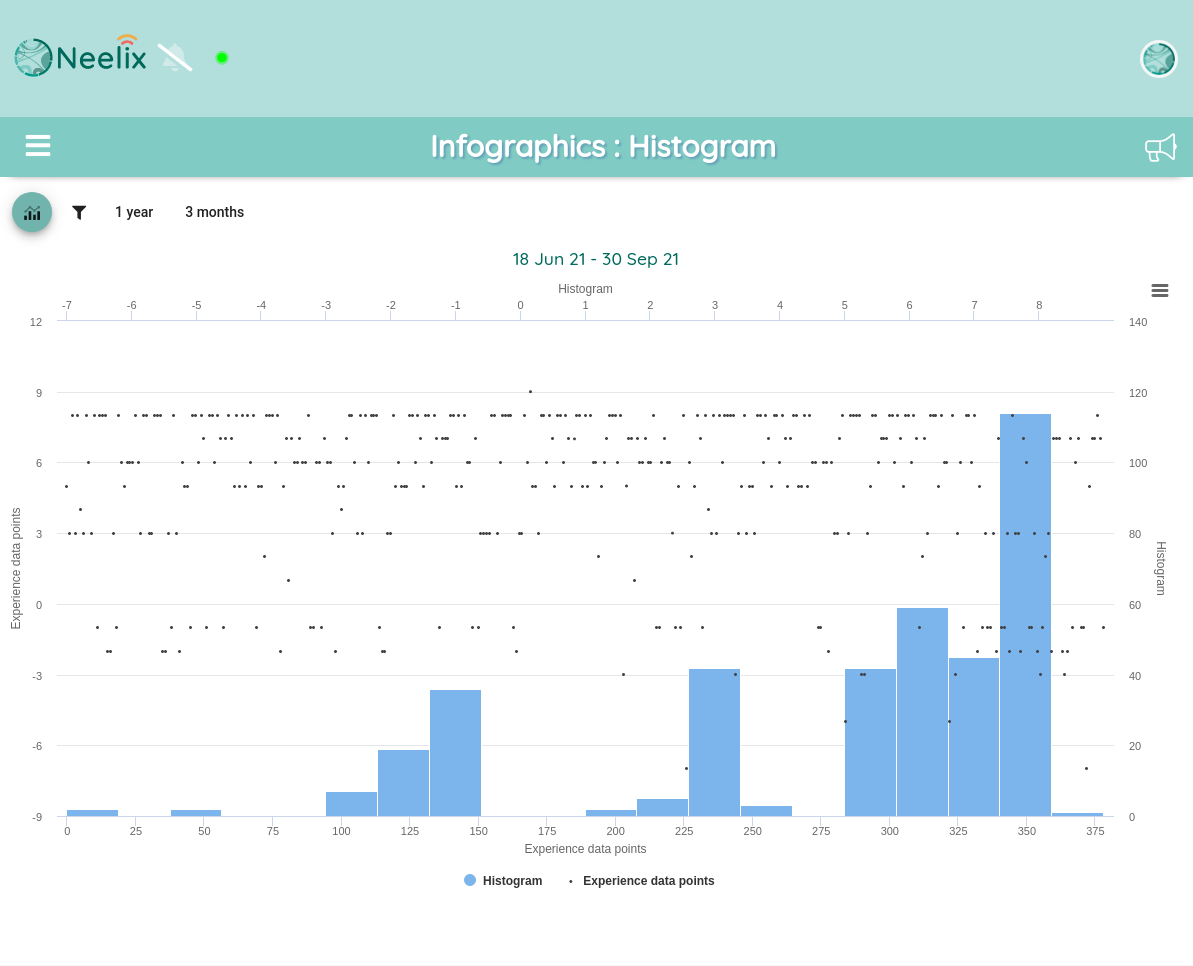
- Histogram charts for journal and retrospective feedback
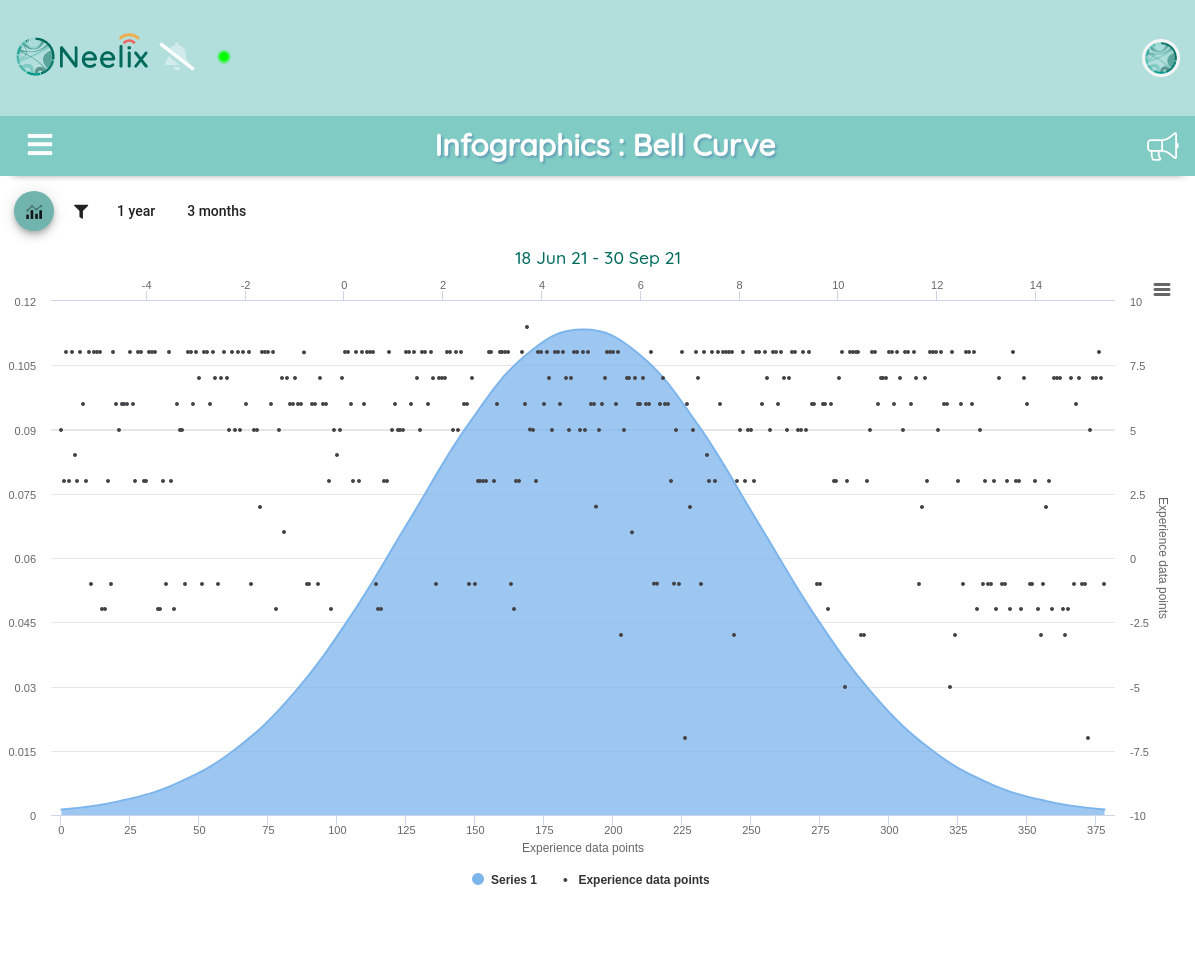
- Bell curve charts for journal and retrospective feedback